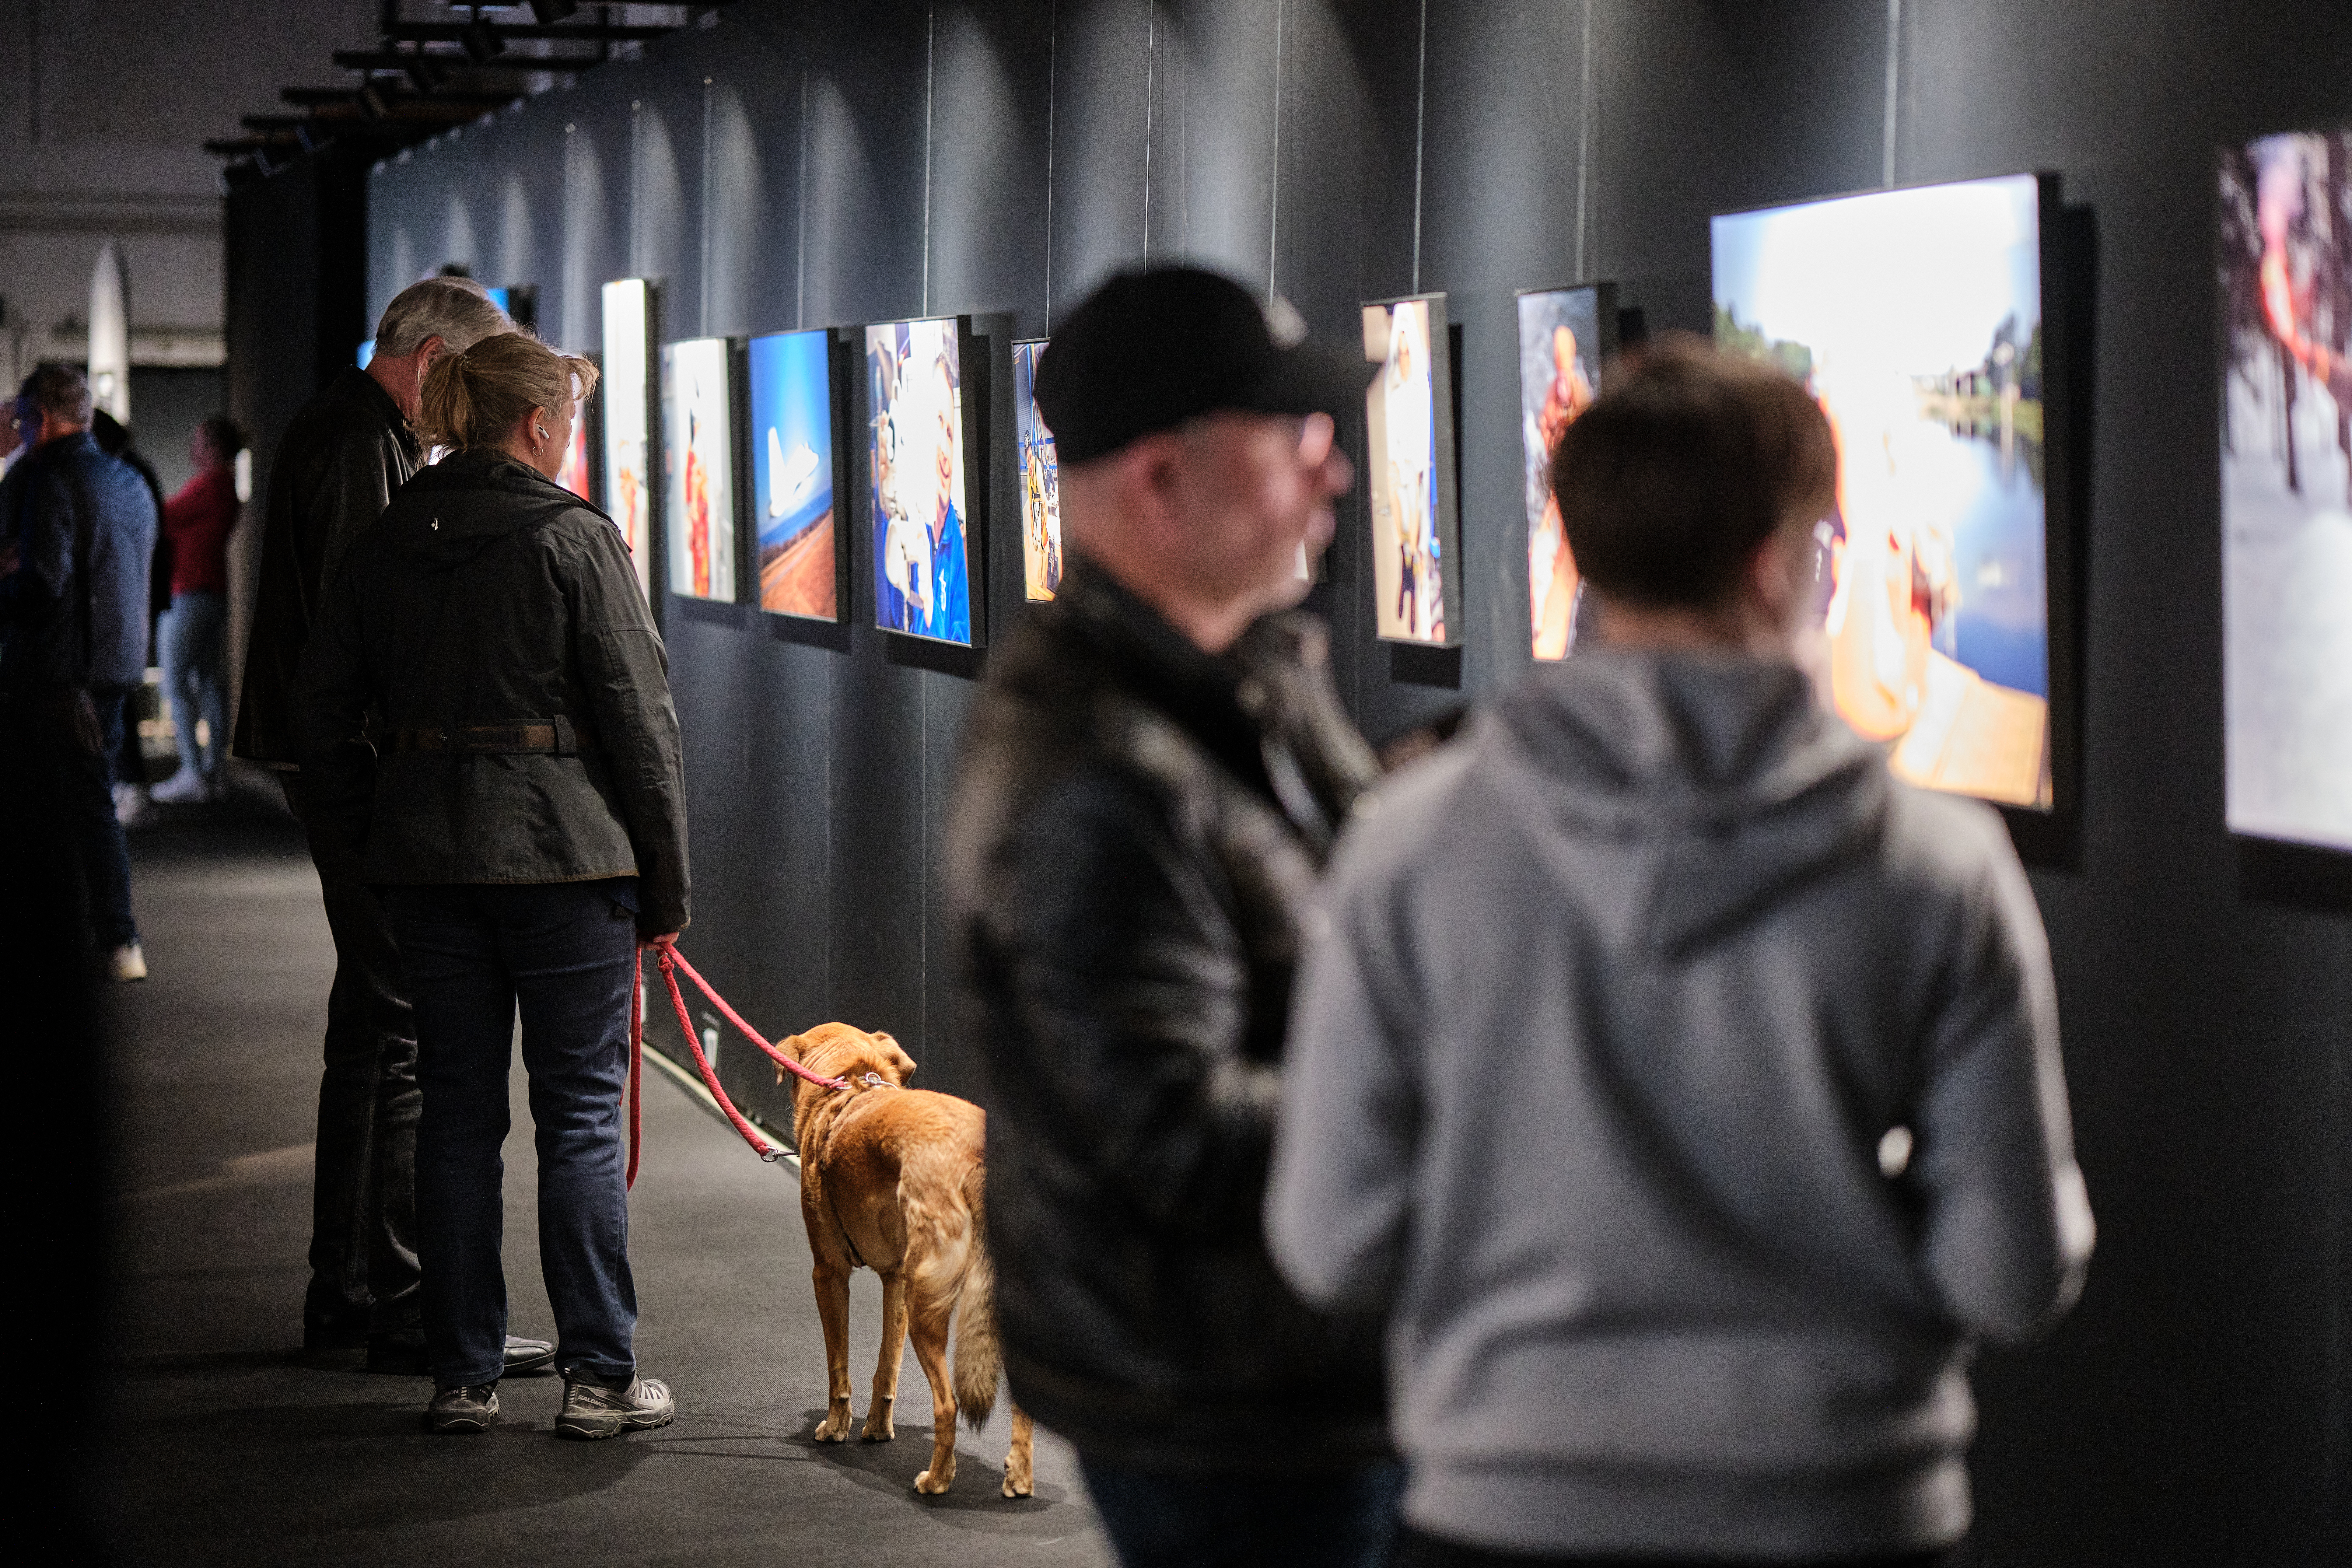
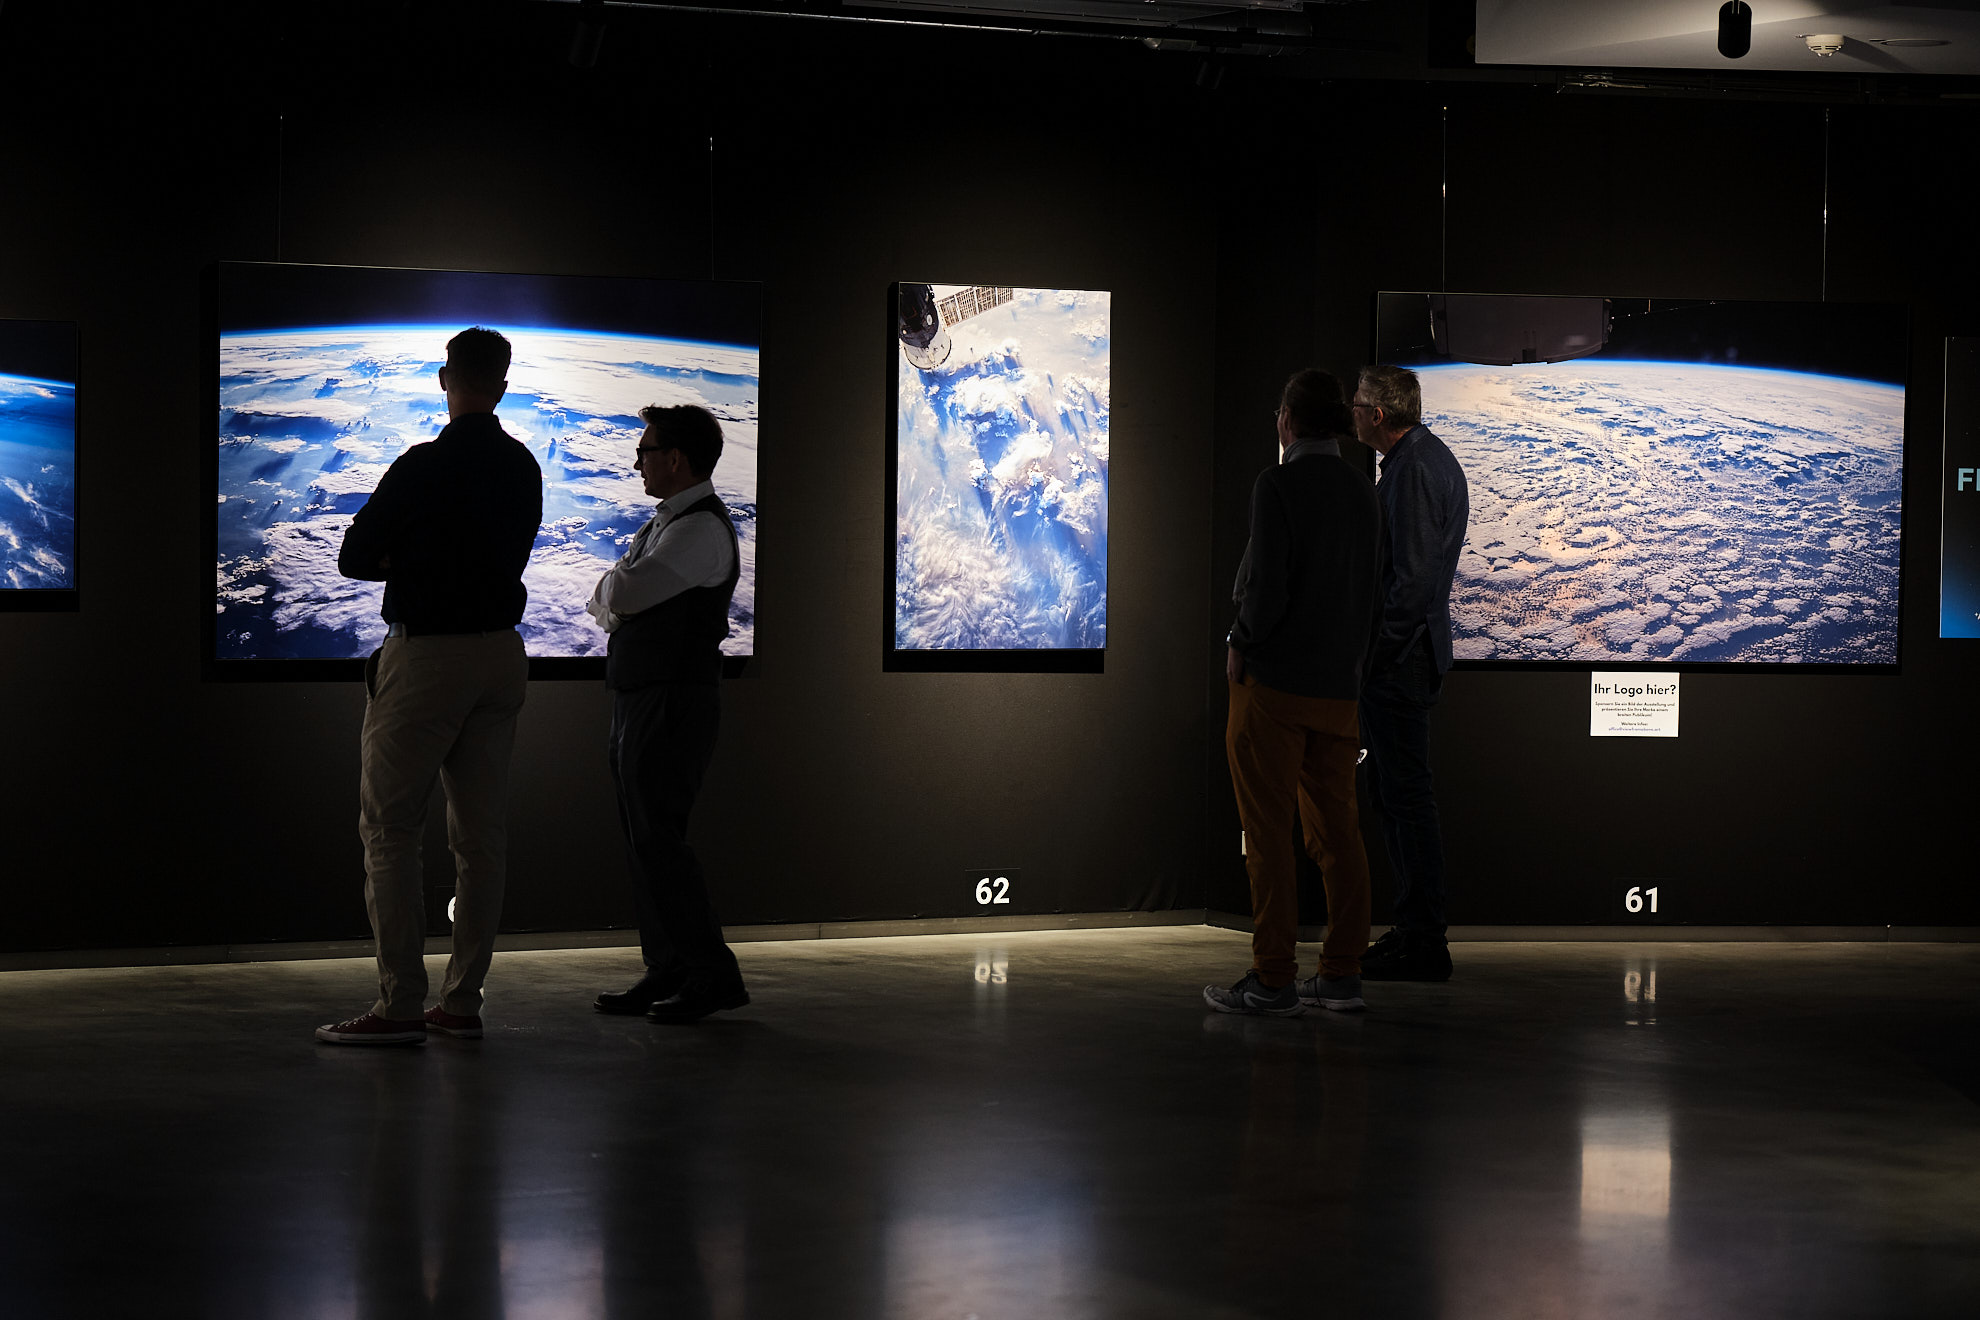
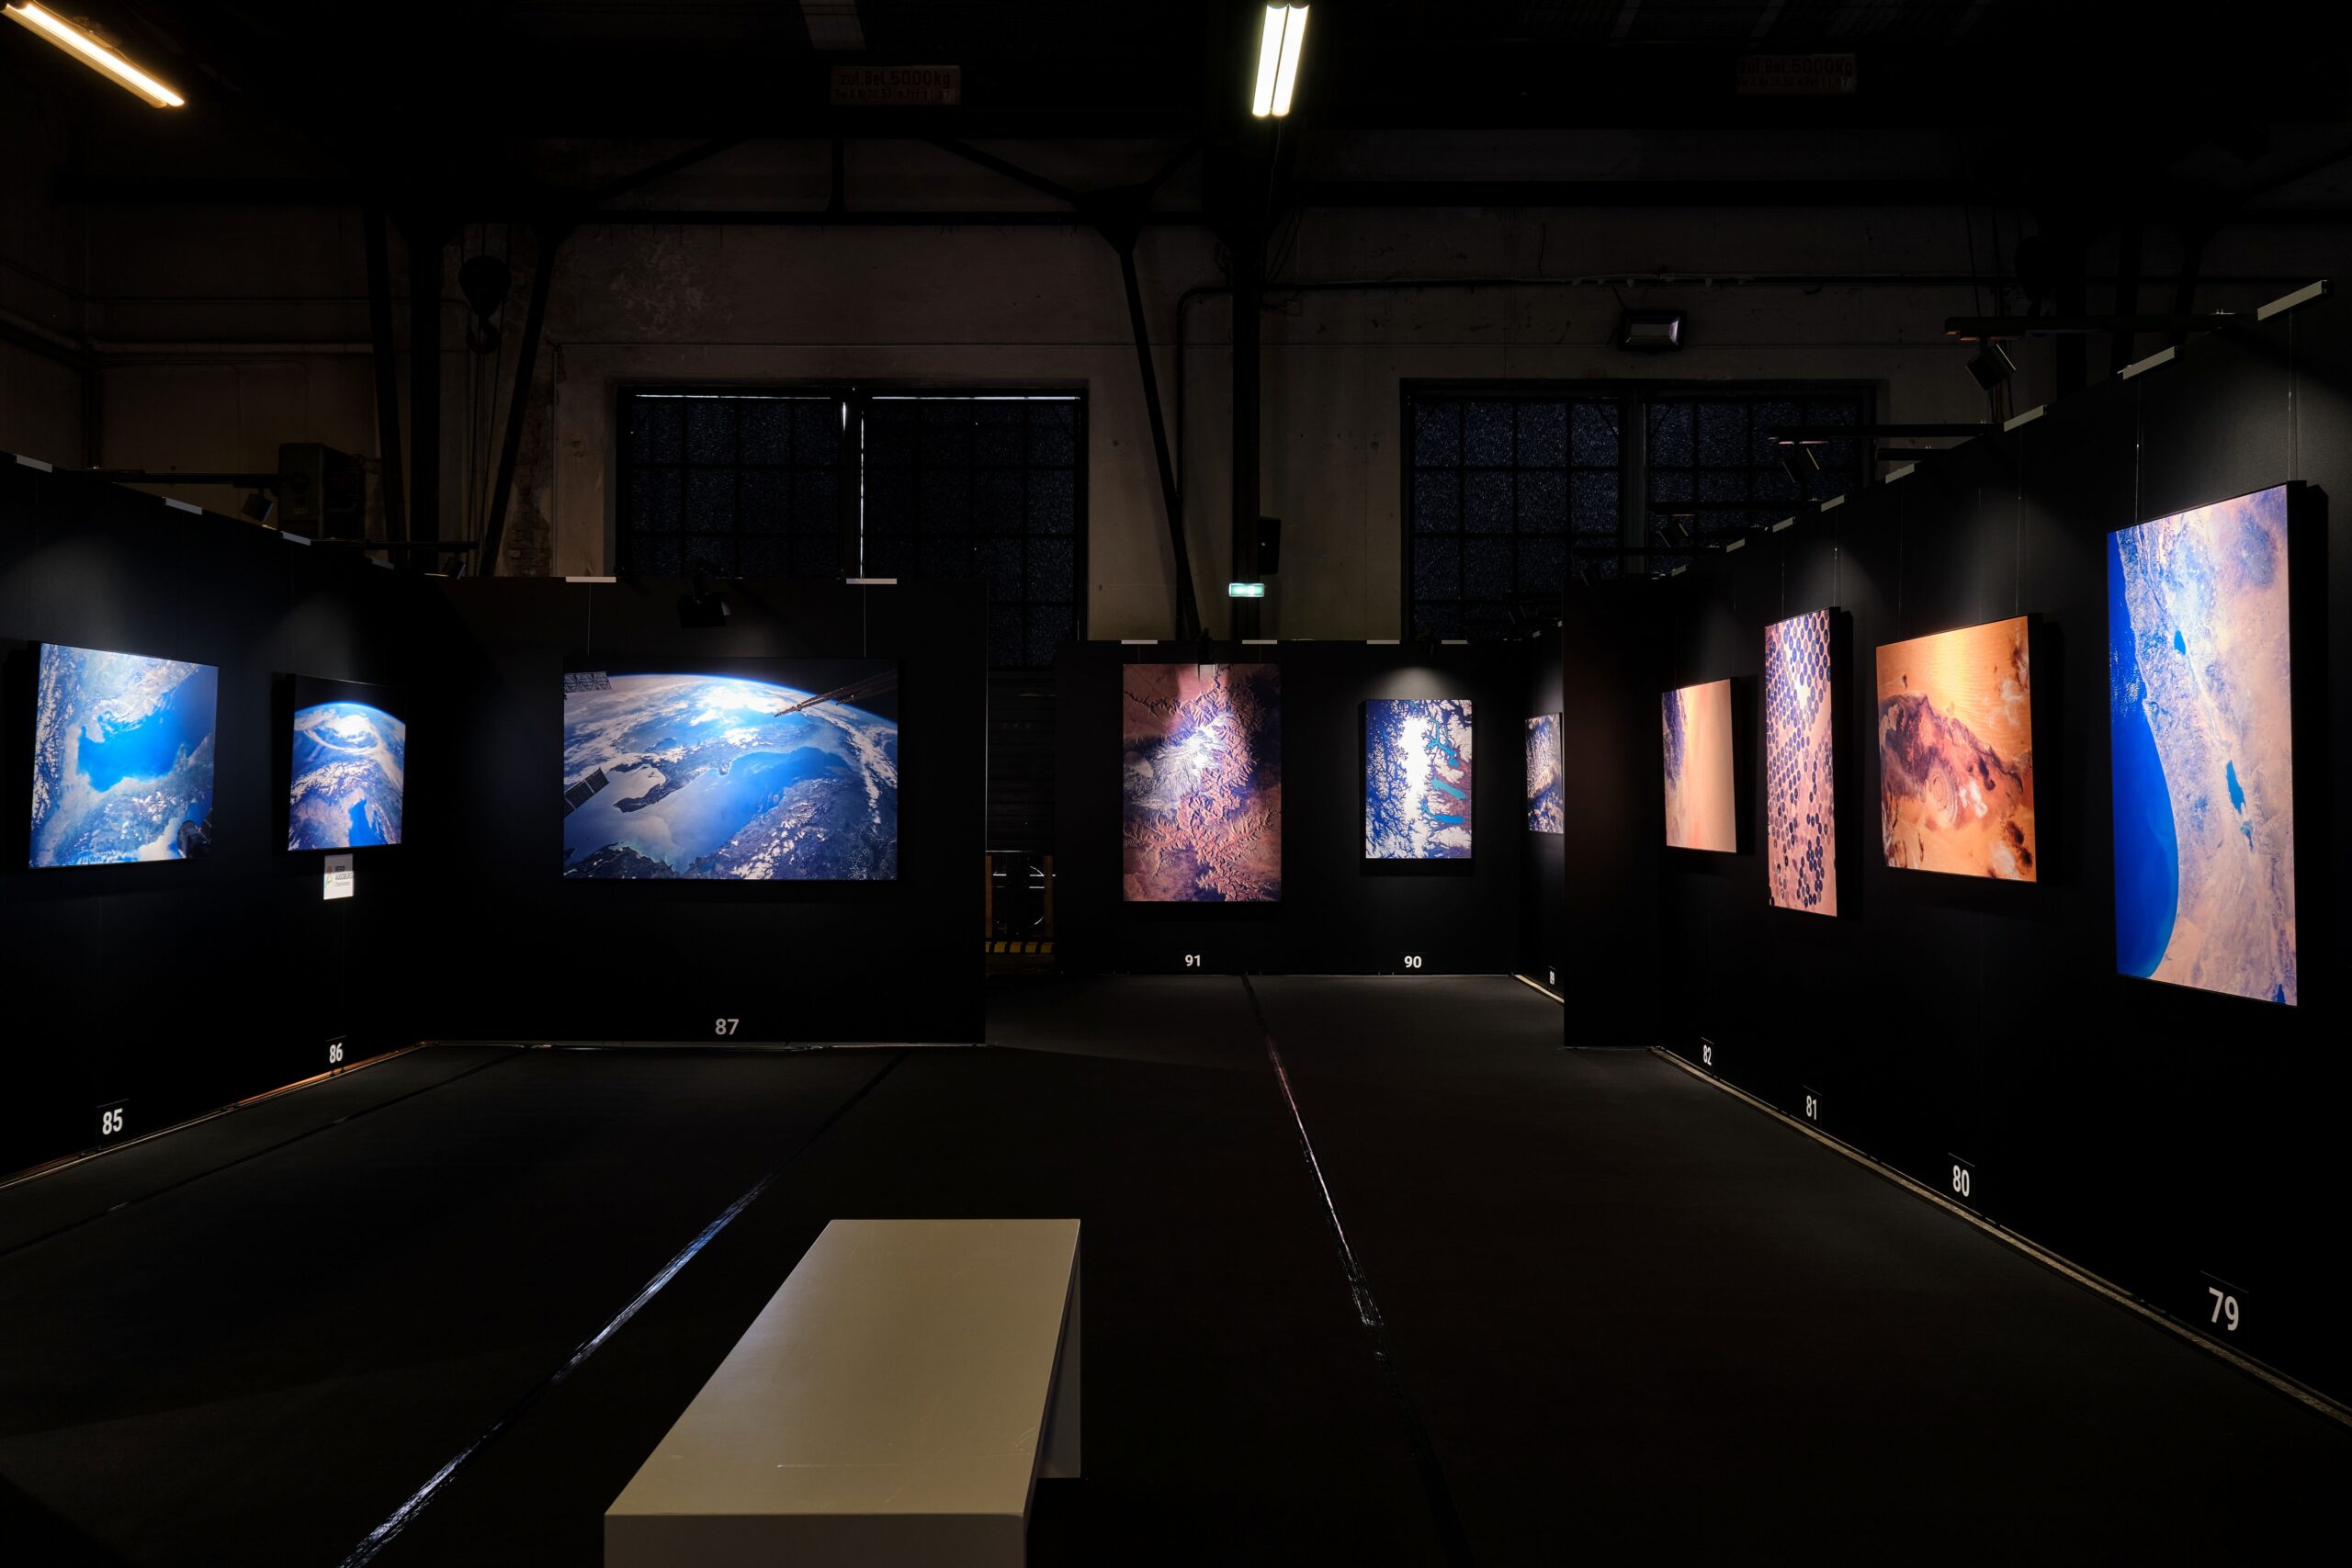
Traveling exhibitions live on iteration. What resonates in Düsseldorf may land differently in Dubai. With scan.art as your audio guide, you don’t just deliver content – you collect privacy-friendly, venue-level insights that tell you exactly which artworks and stories connect with visitors, so you can refine the experience from station to station and strengthen your business model.
As the official audio guide partner of Ready to Show Art, all of their turnkey concepts use scan.art to capture engagement and improve performance across Europe and the Middle East. Learn more about their exhibition formats at www.readytoshow.art.
What you can actually measure
scan.art runs in the browser – no app download, no login, no rental devices – so adoption is high across age groups and the data you see is broad and representative. Depending on your setup (image recognition, QR, or number/text entry), you’ll see:
- Artwork interaction counts: which works are opened most/least
- Listen-through rate (LTR): % of an audio track completed, by artwork and language
- Dwell time: average time spent per artwork page/audio
- Pathways & drop-offs: common routes, where attention peaks or fades
- Language & accessibility split: usage by language, captions, playback speed
- Engagement by time & day: heatmaps that show when content pops
- Device & access mode: image-recognition vs QR vs number entry performance
All metrics are presented in aggregate and without personal accounts or PII, keeping the experience simple for visitors and straightforward for hosts.
From data to decisions – between venues
Curate smarter
- Keep, swap, or expand artworks based on interaction and LTR.
- Tune story length: shorten tracks with low completion; deepen topics with high repeat plays.
- Version by audience: identify cities where kids’ or beginner tracks outperform expert tracks.
Refine layout & flow
- Promote bottleneck pieces to larger bays; relocate under-seen works to natural pause points.
- Use time-of-day heatmaps to add wayfinding or staff where queues emerge.
Optimize language & accessibility
- Add or prioritize languages where engagement lags due to comprehension.
- Enable captions or text-only for venues with higher silent-mode usage.
Align marketing and PR
- Feature the genuine Top 5 audience favorites in teasers and social posts for the next stop.
- Create press angles around data-backed themes (e.g., “Night-earth photos lead engagement”).
Report sponsor value
- Provide impression and listen metrics for sponsor intros or segment idents.
- Attribute uplift when sponsored content sits before high-performing artworks.
Merchandising & revenue adjacencies
- Let engagement inform book spreads, poster selections, and postcard racks.
- If you correlate with POS exports, identify works that best convert to shop sales.
How analytics strengthens the business model
- Higher visitor satisfaction → better reviews → stronger ticket demand
Sharper storytelling and layout lead to longer dwell times and word-of-mouth that moves the needle. - Sponsor ROI you can prove
Clear, comparable metrics across cities make renewal and upsell conversations easier. - Smarter staffing and operations
Schedule teams for peak hours and hotspots, reduce queue friction, and trim unnecessary devices or signage. - No hardware, lower costs
Visitors use their own phones; hosts skip device fleets, charging carts, and maintenance – ideal for fast turnarounds between cities.
A simple, visitor-first setup
- One-tap onboarding at the entrance – no app, no account, no friction.
- Three access modes – image recognition, QR, or number/text entry — chosen per venue.
- Clean walls, clean data – no stickers required next to each artwork if you prefer image recognition or number entry.
A quick improvement loop you can reuse in every city
- Baseline: Run the first venue, collect a full week of analytics.
- Review: Flag top and bottom 10% by LTR and dwell time per section.
- Adjust: Re-record two or three tracks, reorder one corridor, add one targeted language.
- A/B: Test short vs. long narration on a single theme wall in the next venue.
- Repeat: Standardize what wins; retire what doesn’t. Bring sponsors the deltas.
Ready to turn engagement into insight?
If you’re organizing a traveling exhibition – or partnering with a turnkey provider like Ready to Show Art – scan.art gives you the evidence to improve fast and grow sustainably, city after city.
Want a sample dashboard with your current floor plan, tracks, and languages? Send us a note, and we’ll mock up what your first month of insights would look like.


